Isohyet maps are used to express the amount of rainfall in a certain time range. The map above is an isohyet map of Hong Kong which uses connecting contour lines and values to group together equal values.
This isotach map branches over Kansas, Nebraska, and Iowa. Isotach maps are used in meteorology to express wind speeds of an area. These maps like isobar maps also have connecting lines at points of equal speeds.
An isobar map is used for plotting weather data. This map uses connecting lines at equal points on the map that represent pressure. The map shows the high and low levels.
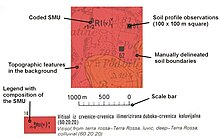
Soil maps are used for gardeners with huge fields. They have to keep up with the different types of soils and textures. Without this map, the gardener can have different types of soils in places and it could mess up the fields.
Bar graphs are used for a huge bundle of things. Bar graphs are used to determine how much money is coming to a company each year and this graph displays 4th quarter regional revenue.
LIDAR (Light Detection And Ranging) is a technology that uses satellites for mapping. The above map is a LIDAR map depicts the city using laser technology.
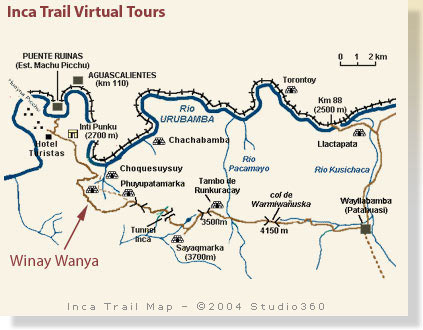
Trail maps are mainly for hikers and campers. These maps display routes in the woods mainly and how many miles it takes to get there. This map displays where the hotel is located and different counties.