Lorenz Curve shows the difference between equality inequality. It is talking about economics and how it affects population and income.
So You Want to Know About Maps?
Tuesday, July 24, 2012
Graduated Symbol Map
Graduated symbol maps are used with circles, triangles, and squares to show symbols. These maps show the motor vehicle deaths in Florida and where most of the deaths took place. There is a high death rate in the western part of Florida.
Box Plot

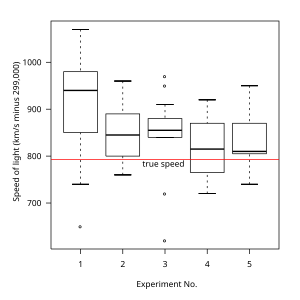
Above is a box plot of an experiment that involves the true speed of light. Box plots, also know as box and whisker plots displays the statistical data of the lower quartile, median, upper quartile, and outliers. This map allow for conclusions to be made based upon researched data.
3D Map
3D mapping is used a ton today. Using 3D occurs in movie theaters and GPS systems. GPS systems are unique because it shows building and roads in 3D.
Similarity Matrix

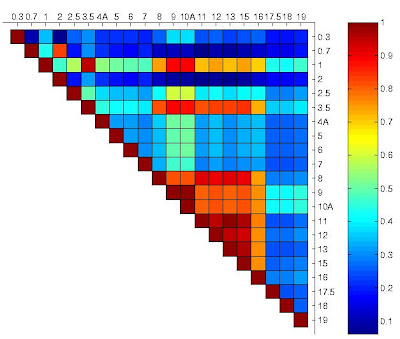
A similarity matrix is used to connect two similar data points. This similarity matrix connects corrolated behavior between proteins.
Similarity Matrix
DLG map
DLG stand for digital line graph. It is a cartographic map that displays map vectors. In this map it display where water is located in specific places.
Isopach

This isopach map above uses a colored map key and contour lines to express the thickness of an area. Isopach maps such as these can be used to when dealing with geographic drilling and structural building.
Subscribe to:
Comments (Atom)


